
If you run a small fleet, you have probably looked at GPS tracking more than once and wondered whether the monthly fee is actually worth it. The marketing pages are full of vague claims about efficiency and visibility, and most of them skip the math. This article tries to do the opposite. Fleet tracking ROI is calculable, but it is not automatic, and the size of the return depends heavily on what your fleet looks like and how seriously you use the data. What follows is the standard formula, the five categories where savings come from (with honest sourcing on each), a worked example for a realistic eight-van plumbing company, and a clear discussion of what has to be true for the numbers to work in your business. The point is to give you a framework you can plug your own numbers into, not to convince you that any particular result is guaranteed.
The ROI Formula for Fleet Tracking
The standard ROI formula is straightforward.
ROI (%) = ((Annual Savings − Annual Cost) ÷ Annual Cost) × 100
The two inputs are the annual cost of the tracking system and the annual savings it generates. Annual cost is easy to pin down because the pricing is public. For Surety Business Fleet, the most common pricing tier (2 to 20 vehicles) is $12 per vehicle per month, plus a one-time hardware cost of $99 per vehicle for the ADC-CC100 Car Connector. Amortize the hardware over three years (a conservative life estimate for a plug-in OBD-II device) and the annual cost works out to ($99 divided by 3) plus ($12 times 12), which equals $33 plus $144, or $177 per vehicle per year. There are no contracts, no activation fees, and no hidden equipment leases.
Annual savings is the variable people get wrong, usually by only counting one or two categories. There are five places where measurable savings tend to show up: fuel, productivity, maintenance, insurance, and unauthorized use. The next five sections walk through each one with the source of the figure, the conditions that have to hold for it to materialize, and concrete dollar math. A note on sourcing up front: several of the most-cited percentage figures in the telematics industry come from vendor-published reports based on customer surveys. They are useful as directional benchmarks, but they are not independent academic studies, and customer-reported savings tend to skew optimistic. Where that is the case below, it is called out.
Fuel Savings, the Biggest Line Item
For most service fleets with significant miles driven, fuel is the largest single source of ROI. The most commonly cited figures put telematics-driven fuel savings at roughly 10 to 16 percent. Verizon Connect's 2025 Fleet Technology Trends Report (a customer survey, not an independent study) reported a jump from 9 percent in 2024 to 16 percent in 2025 as fleets moved beyond basic GPS into idle, driver behavior, and maintenance data. Vendor-adjacent studies from Ridecell, MiX by Powerfleet, and Geotab cluster in the 10 to 15 percent range. These are reasonable benchmarks but worth treating as the upper end of what a typical small fleet might expect, especially in the first year. Actual savings depend on how much waste exists before tracking is installed and how actively the data is used. The savings come from three specific behaviors that tracking makes visible and therefore manageable.
The first is idling. The U.S. Department of Energy estimates that roughly 6 billion gallons of fuel are wasted every year in the United States from vehicle idling alone. A single idling vehicle burns 0.5 to 1 gallon per hour depending on engine size. Run the math on a fleet of ten vehicles each idling 30 extra minutes a day at $4.00 per gallon and 250 work days a year, and you are burning roughly $3,000 per year in fuel that produces nothing. Idle time alerts and per-vehicle idle reporting eliminate most of that waste within the first month, because drivers self-correct as soon as they know it is being measured.
The second is aggressive driving. The U.S. Department of Energy reports that hard acceleration, sudden braking, and speeding can increase fuel consumption by 15 to 30 percent compared to smooth, steady driving. Two identical trucks on similar routes can differ by a fifth in fuel economy purely because of how they are driven. Driver behavior scoring identifies the highest-cost drivers so coaching can be targeted where it matters, and the monitoring itself reduces the behaviors without confrontation.
The third is route inefficiency, which trip history and mileage reports surface immediately. Put it together with a concrete example: a 10-vehicle service fleet spending $60,000 per year on fuel and achieving a 12 percent reduction saves $7,200 per year, several times the cost of the tracking system from fuel alone. The important caveat: this is contingent on actually using the data. A fleet that installs the devices but never reviews idle reports or coaches drivers will see a much smaller savings, possibly close to zero. For a deeper walk-through of the fuel mechanics, see How to Reduce Fleet Fuel Costs with GPS Telematics.
Productivity, More Revenue Without More Headcount
The productivity gains from GPS-based dispatch are where fleet tracking can move from a cost-saving tool into a revenue-generating one, but only for businesses that actually use a dispatcher and whose jobs are routable on short notice. With real-time vehicle locations on a live map, a dispatcher can route urgent calls to the nearest technician rather than the next available one on the schedule, which reduces drive time. Industry figures commonly cite a roughly 10 percent increase in jobs completed per day per vehicle once GPS dispatch is in use, though these figures are almost always vendor-reported and should be treated as a ceiling, not a guarantee.
For service trades, each additional job per day per vehicle is typically worth $200 to $500 in billable revenue. At a conservative pace of one extra job every two weeks per van, a 10-vehicle fleet adds 250 incremental jobs per year, or about $75,000 at $300 per job. That is meaningful upside for the right kind of business. It is also the category that requires the most honest self-assessment: a business with a fixed daily schedule, no real-time dispatching, or jobs too large to squeeze in extras will not realize this revenue regardless of what the data shows. The ROI calculation later in the article deliberately excludes productivity revenue for this reason, so the conservative case does not depend on it.
Trip logs deliver a second, smaller productivity gain. Timestamped arrivals and departures eliminate the kind of billing disputes and "no-show" claims that quietly erode revenue. When a customer says your crew never showed up or arrived late, you can pull up the trip record and resolve the issue in seconds, with documentary proof that protects both the business and the technician.
Maintenance, Preventing Expensive Breakdowns
A good fleet tracker is also a real-time vehicle diagnostics tool. The ADC-CC100 reads OBD-II diagnostic trouble codes (DTCs) directly from the vehicle's onboard computer the moment they appear and pushes an alert to the dashboard. The often-cited figure for proactive DTC-based maintenance is a 20 percent reduction in maintenance costs compared to a reactive, breakdown-driven approach. This number is industry-reported (largely by telematics vendors and trade associations) rather than independently studied, and it assumes the alerts are actually acted on quickly. A fleet that ignores DTC alerts, or a fleet that already runs disciplined preventive maintenance, will see less from this category.
That said, the underlying mechanics are well established. The U.S. Department of Energy reports that a faulty oxygen sensor (one of the most common engine fault codes) can reduce fuel economy by up to 40 percent, and a misfiring engine can reduce fuel economy by up to 4 percent. Both faults trigger DTCs that a tracker catches the day they appear, often before the driver notices a problem. Beyond fuel, the bigger savings come from avoided breakdowns: an unexpected roadside failure adds towing fees, emergency labor rates, possible rental vehicles, and missed customer appointments. For a 10-vehicle fleet spending $2,000 per vehicle per year on maintenance, a 20 percent reduction would be $4,000 per year. The realistic range for a typical small fleet is probably 10 to 20 percent depending on how reactive the existing maintenance program is.
Insurance, a Savings Category People Forget
Fleet insurance has gotten expensive. Industry data puts the going rate at roughly $0.102 per mile in 2026, so a fleet putting 100,000 miles a year on the road can easily pay north of $10,000 per vehicle in annual premium before claims history is factored in. Some carriers offer premium reductions of up to 10 percent for fleets with active driver behavior monitoring programs, on the view that monitored fleets are measurably lower risk. The important caveat: this discount is carrier-dependent, not universal, and the size varies. Before counting this category in your own ROI math, call your insurance broker and ask whether your carrier offers a telematics discount and what documentation they require. If they do not, the insurance line in the calculation drops to zero.
The premium reduction is only half of the insurance benefit. The other half is the data itself. When a liability claim happens, having a documented record of speed, hard braking, route, and exact location at the time of an incident is useful evidence. It supports the business when a claim is unfounded, or it helps the insurer settle quickly when fault is clear. For a fleet paying $12,000 per year in fleet insurance with a carrier that offers a monitored-fleet discount, a 5 to 10 percent reduction is $600 to $1,200 per year in direct savings. For a fleet whose carrier offers nothing, this category is worth zero until they switch carriers or renew.
Unauthorized Use, Stopping the Hidden Leaks
This is the softest of the five categories on a per-business basis, because it depends entirely on whether unauthorized use is happening in your fleet today. If you trust your drivers and have low or no after-hours use, this category may be close to zero. If you have ever wondered why one van is putting 30 percent more miles on the odometer than the others, it could be substantial. Industry estimates often quote $1,000 or more per vehicle per year in SMB fleet operational inefficiency losses (a bucket that includes unauthorized use, idling, and route waste, which means it overlaps with the other categories above and should not be added on top of them at full value). Geofencing alerts for after-hours movement and boundary violations tend to eliminate the bulk of unauthorized use within weeks, because drivers self-correct as soon as they know the trips will be visible the next morning.
There is also a pure asset protection benefit. Service vehicles often carry thousands of dollars in tools, parts, and equipment, which makes them attractive theft targets. Real-time GPS supports rapid recovery if a vehicle is stolen, and the ADC-CC100's tamper alerts and backup battery continue reporting even if the device is unplugged or the vehicle's power is cut. A single recovered vehicle with its tools intact can pay for years of fleet tracking. The conservative figure used in the worked example below is $500 per vehicle per year for this category, which is roughly half of the industry-cited efficiency-loss figure to avoid double-counting with fuel and maintenance. If unauthorized use is not a real issue in your fleet, set this to zero in your own calculation. For more on the privacy and policy side of company vehicle monitoring, see How to Track Company Vehicles Without Creating an HR Problem.
Putting It All Together, a Full ROI Calculation
Here is what the math looks like for one realistic profile: an eight-van plumbing company with moderate fuel, maintenance, and insurance numbers for the trade. The point of this example is to show the structure of the calculation, not to claim that every fleet will land here. A landscaping outfit with shorter routes and lower fuel spend will see a much smaller absolute number, while a delivery operation putting 30,000 miles a year on each vehicle will see a larger one. Plug your own numbers in.
Fleet profile. Eight vans. Annual fuel spend of $48,000 ($6,000 per van). Annual maintenance spend of $16,000 ($2,000 per van). Annual fleet insurance of $9,600 ($1,200 per van). Average billable service call value of $280. Four calls per day per van.
Annual cost of fleet tracking. Hardware, 8 vans times $99 divided by 3 years, equals $264 per year. Service, 8 vans times $12 per month times 12 months, equals $1,152 per year. Total annual cost: $1,416 per year, or $177 per vehicle per year.
Annual savings, using mid-range assumptions. Fuel at a 12 percent reduction: $5,760. Maintenance at a 15 percent reduction (below the 20 percent industry figure to account for fleets that already do some preventive maintenance): $2,400. Insurance at an 8 percent reduction, assuming the carrier offers a telematics discount: $768. Unauthorized use reduction at $500 per van, assuming there is meaningful unauthorized use to begin with: $4,000. Total: $12,928 per year. If the carrier does not offer a telematics discount, drop the insurance line to zero and the total becomes $12,160. If unauthorized use is not a real problem in the fleet, drop that line as well and the total becomes $8,160.
ROI, mid-range scenario. ($12,928 minus $1,416) divided by $1,416 times 100 equals approximately 813 percent for this specific fleet profile. Payback period: roughly 1.3 months. This is a large number, and it is real for a fleet with this spend profile that actually uses the system. A more conservative scenario with only the fuel and maintenance categories (no insurance discount, no unauthorized use) still produces savings of $8,160 against a cost of $1,416, or roughly 476 percent ROI with a payback period of about 2.1 months. A fleet with half this spend per vehicle would see roughly half the absolute savings (the cost also drops proportionally, so the percentage ROI is similar, but the dollar value is smaller).
Productivity upside (not counted in the ROI above). For a fleet that uses real-time dispatching, one extra job per van per week at $280 per call across 50 working weeks is $112,000 per year for an 8-van fleet. Even one extra job every other week is $56,000. This is deliberately excluded from the ROI figure so the case is grounded in cost savings, but for many service businesses it is the largest single category of economic benefit. For others it is zero, because their job flow does not allow it. Be honest with yourself about which kind of business you run before including it.
Here is the same math for two common fleet sizes side by side, using the same per-vehicle assumptions as the 8-van example. Read this table as illustrative of the structure, not as a forecast for your specific business. The percentages stay roughly constant across fleet sizes because both savings and cost scale with vehicle count.
| Savings Category (assumed per vehicle / year) | Per Vehicle | 5-Vehicle Fleet | 10-Vehicle Fleet |
|---|---|---|---|
| Fuel (12% of $6,000/van/yr fuel spend) | $720 | $3,600 | $7,200 |
| Maintenance (15% of $2,000/van/yr) | $300 | $1,500 | $3,000 |
| Insurance (8% of $1,200/van/yr, if carrier offers discount) | $96 | $480 | $960 |
| Unauthorized use reduction (if applicable) | $500 | $2,500 | $5,000 |
| Total annual savings (all categories) | $1,616 | $8,080 | $16,160 |
| Annual fleet tracking cost | $177 | $885 | $1,770 |
| Net annual savings (best case in this profile) | $1,439 | $7,195 | $14,390 |
| Conservative case (fuel + maintenance only) | $843 net | $4,215 net | $8,430 net |
Two honest notes on the table. First, the savings scale with per-vehicle spend. A fleet that drives fewer miles, has newer vehicles, or runs lower insurance premiums will see smaller absolute numbers even if the same percentage reductions apply. Second, the "total" line only holds when all four savings categories are actually realized, which requires active use of the data, carrier cooperation on insurance, and a fleet that had real inefficiencies to eliminate in the first place. The conservative row (fuel plus maintenance only) is closer to what a reasonably diligent small fleet can expect without needing anything to go particularly right.
How Alarm.com Connected Fleet Delivers This Data
The hardware that makes the tracking work is the ADC-CC100 Car Connector, a compact OBD-II plug-in device that installs in any vehicle manufactured in 1996 or later in under 5 minutes. There is no professional installation, no wiring, and no tools required. The manager adds it to the fleet account, pops the device into the OBD-II port (the same port a mechanic uses to read codes), and the vehicle is on the network. The CC100 is LTE-connected with a built-in backup battery that keeps it reporting even if it is unplugged or vehicle power is cut, which makes it tamper-resistant and useful for stolen-vehicle recovery.
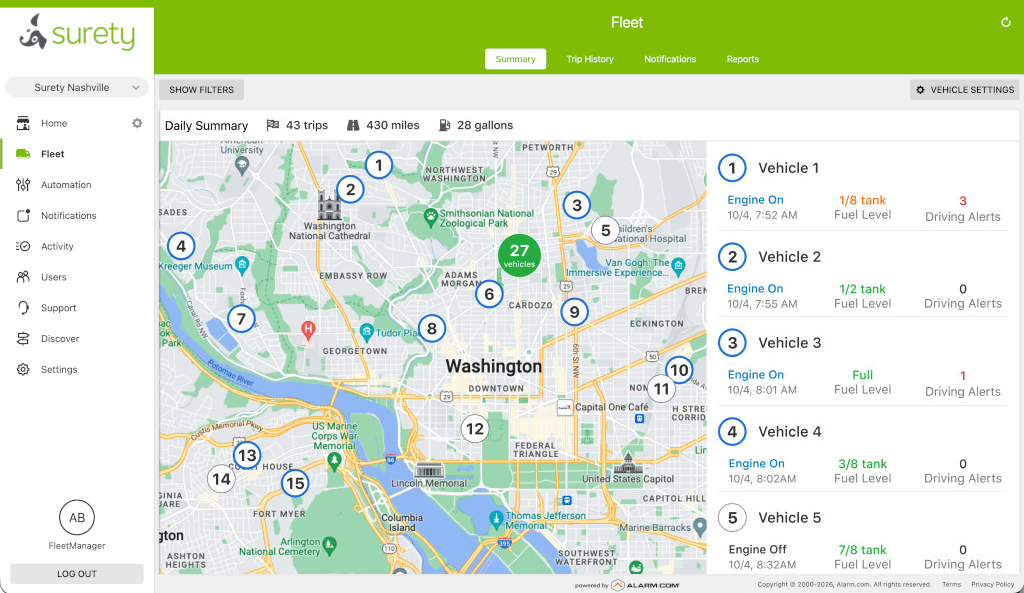
On the software side, Alarm.com Connected Fleet provides real-time GPS tracking on a live map, geofencing alerts for entering or leaving zones and after-hours movement, idle time monitoring per vehicle and per trip, driver behavior tracking (speeding, hard acceleration, sudden braking), fuel consumption and MPG reporting, fuel level monitoring on vehicles from 2010 and newer, OBD-II diagnostic trouble code alerts in real time, and Fleet Trip Reports delivered daily, weekly, or monthly by email. The enterprise dashboard supports up to 100 vehicles per site across multiple locations, which means a multi-branch operation can roll up across all of its locations in a single view. For a deeper background on what telematics is and how it works at a technical level, see What Is Vehicle Telematics?.
One of the biggest practical advantages of running fleet on Alarm.com & Surety Business is that it sits on the same platform as security alarm, cameras, and access control. Fleet events and security events show up in the same dashboard and the same mobile app. A burglar alarm at your shop and an after-hours geofence violation on a service van are both visible in one place, with one login. Bundling fleet with a Surety Business alarm monitoring plan also saves $3 per vehicle per month, which lowers the per-vehicle pricing further.
What Does Fleet Tracking Cost at Surety Business?
Pricing is month-to-month with no contracts, no activation fees, and no hidden equipment lease. Hardware is $99 per device, one-time, with no monthly hardware fee.
| Fleet Size | Monthly per Vehicle | Annual per Vehicle | Hardware (per vehicle, 3-yr amortized) | Total Annual Cost per Vehicle |
|---|---|---|---|---|
| 1 vehicle | $15 | $180 | $33 | $213 |
| 2-20 vehicles | $12 | $144 | $33 | $177 |
| 21-50 vehicles | $10 | $120 | $33 | $153 |
| 51+ vehicles | $8 | $96 | $33 | $129 |
For context, comparable enterprise telematics platforms (Samsara, Verizon Connect, Geotab) typically run $20 to $40 or more per vehicle per month, generally on annual contracts and often with professional installation requirements. Lower-cost consumer trackers like Bouncie come in around $8 per vehicle per month but lack driver behavior scoring, idle reporting, and OBD-II diagnostics, which removes most of the savings categories described above. For a head-to-head comparison, see Bouncie vs Linxup vs Surety Business Fleet. Linxup tends to run $20 to $30 per vehicle per month and contracts are common. Setup details and supported features are documented in the Surety Business Fleet support guide.
The Bottom Line
The honest version of the pitch looks like this. For a service fleet with meaningful per-vehicle fuel and maintenance spend, and an owner willing to actually use the data (review idle reports, act on DTC alerts, set geofences, talk to the insurance broker), the cost of fleet tracking is typically a small fraction of the savings it produces. For a fleet with very low miles driven, modern vehicles that rarely break down, no unauthorized use, no dispatcher, and a carrier that does not offer a telematics discount, the math is much closer and may not clear the bar. Most small service fleets sit somewhere between these two extremes. The only way to know where your business lands is to run your own numbers through the formula above, with realistic assumptions for each of the five categories, and to be willing to drop a category to zero if it does not apply. If the result still clears your bar after honest inputs, it is a defensible spend. If it does not, that is useful information too. Surety Business offers the tracking at month-to-month pricing with no contract, which at least means the downside of finding out is limited.
